Strength progression
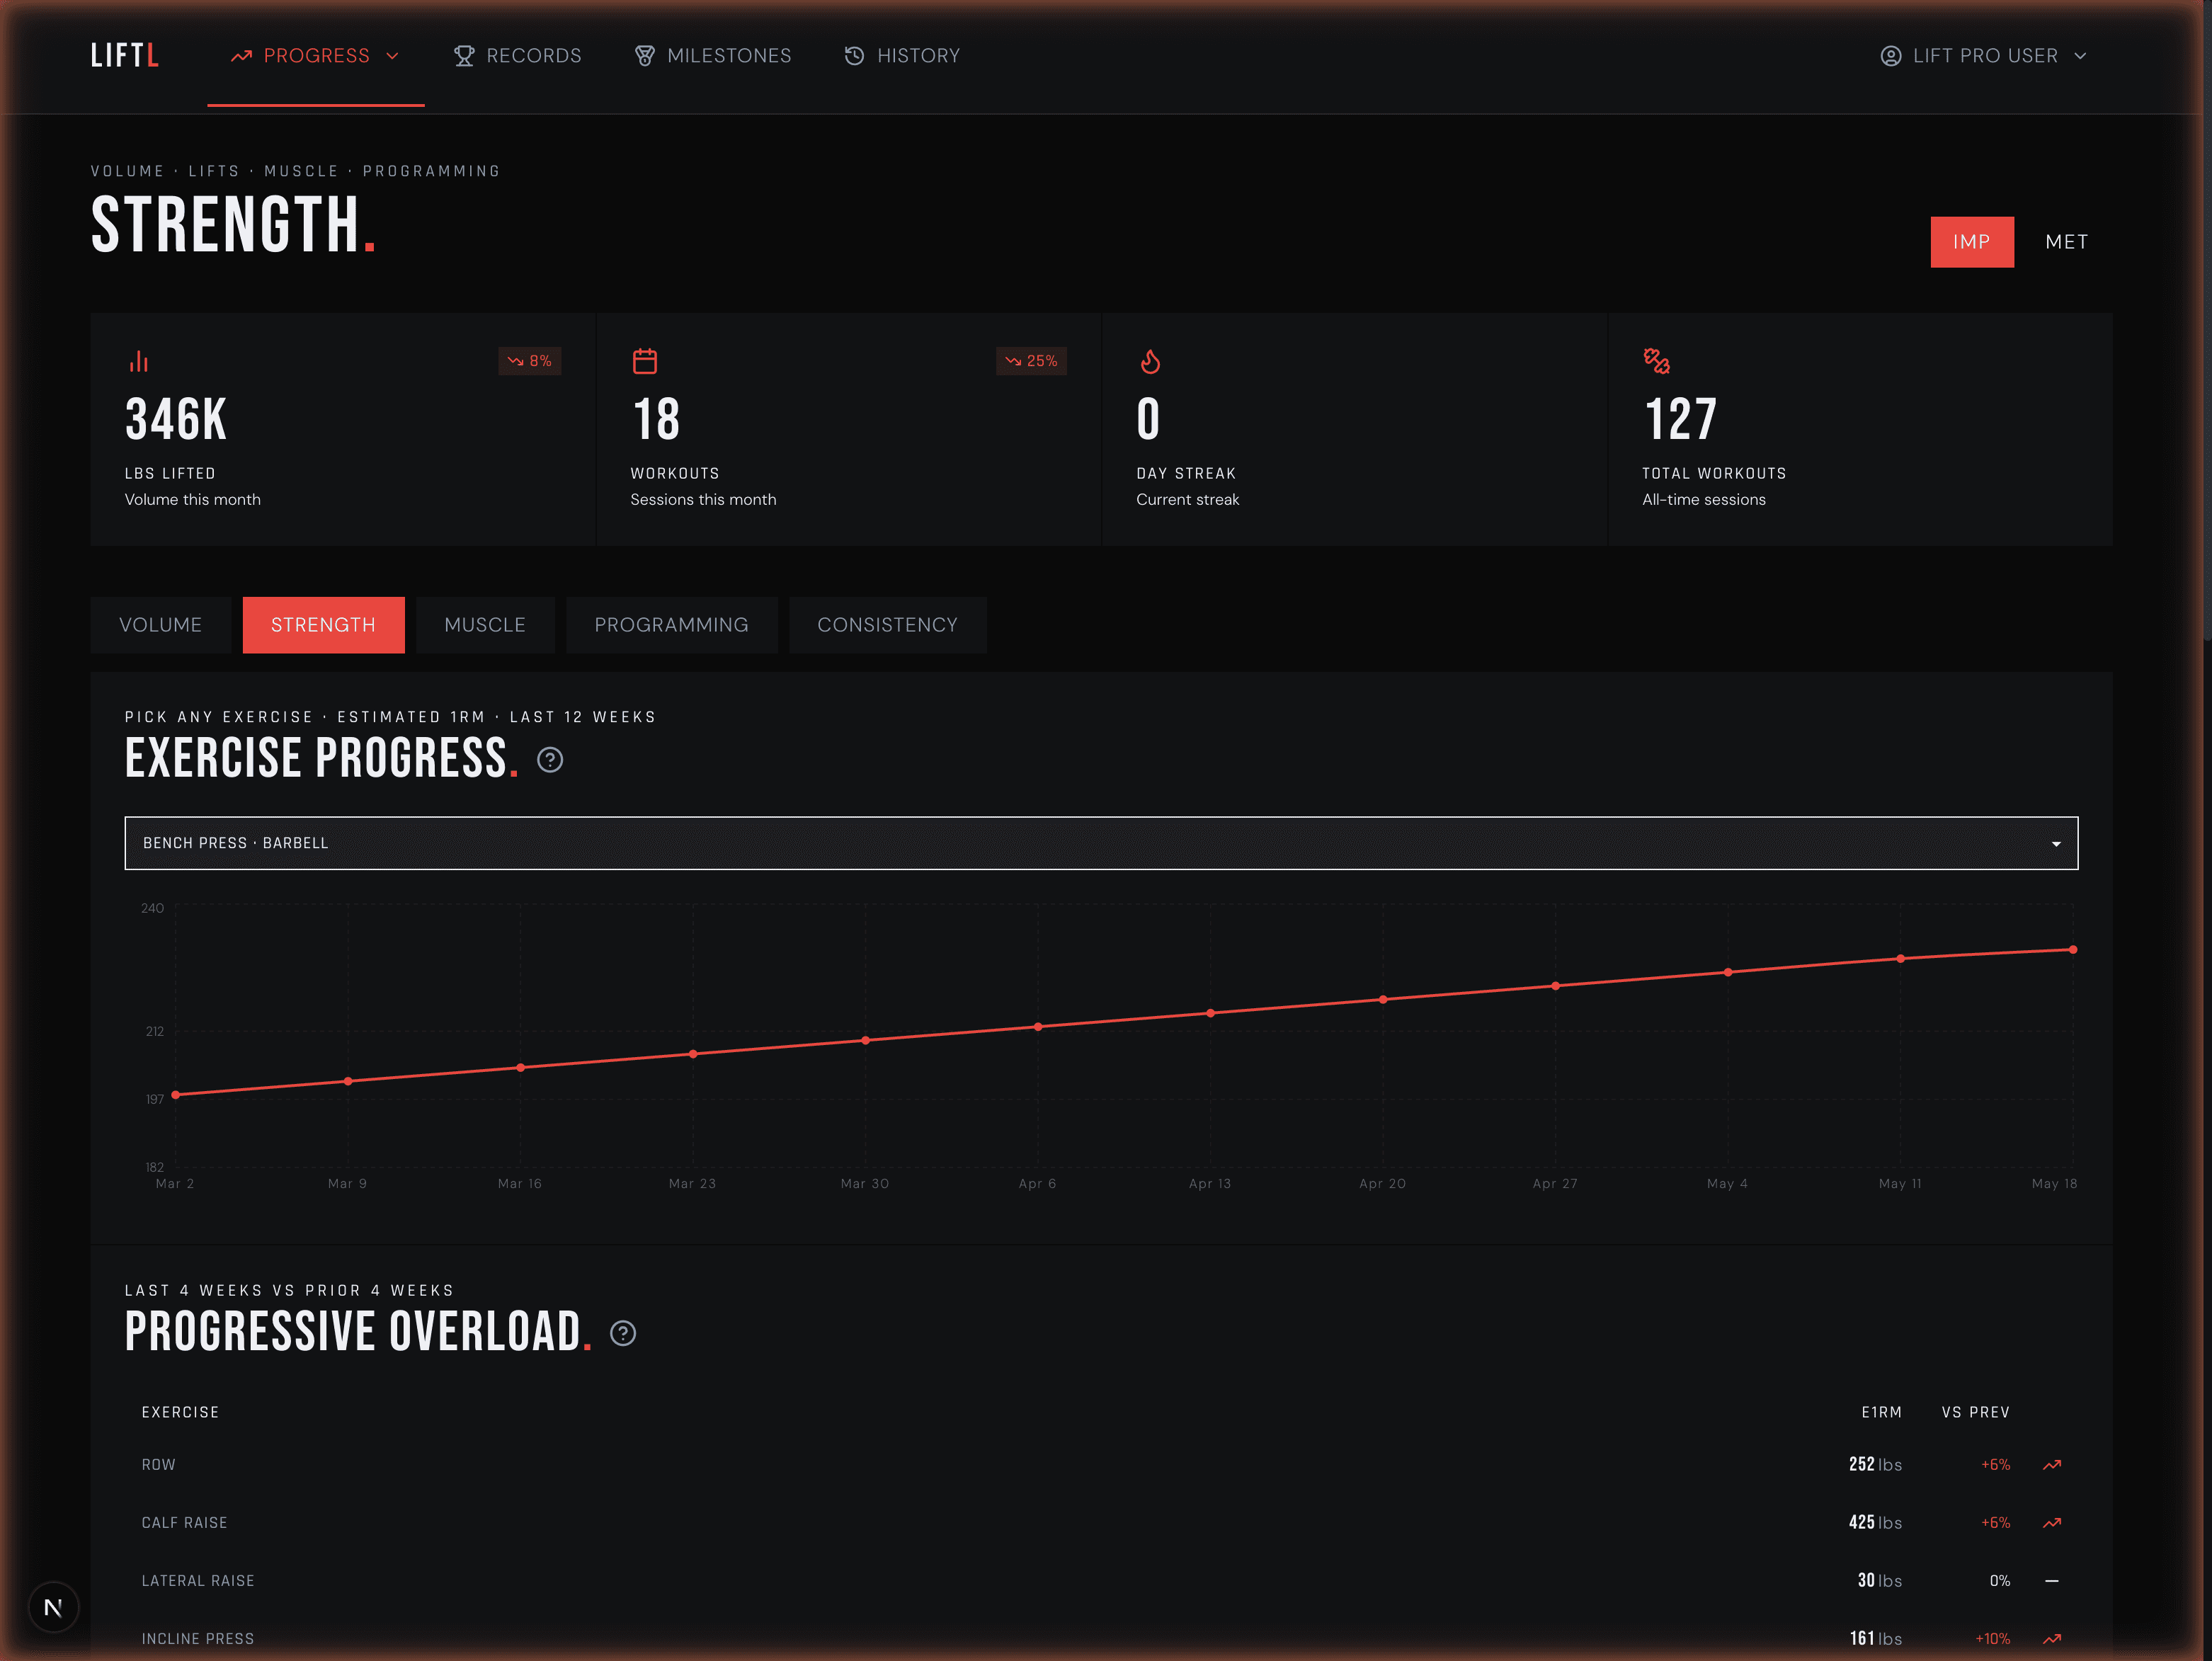
Chart estimated 1RM by exercise and compare recent performance with the prior training block.
Advanced lifting analytics
LIFTL turns workout history into useful training context: how strength is trending, where volume is going, how your current workload compares with your baseline, and which records moved.
Product facts reviewed
Three views of the same history
Chart estimated 1RM by exercise and compare recent performance with the prior training block.
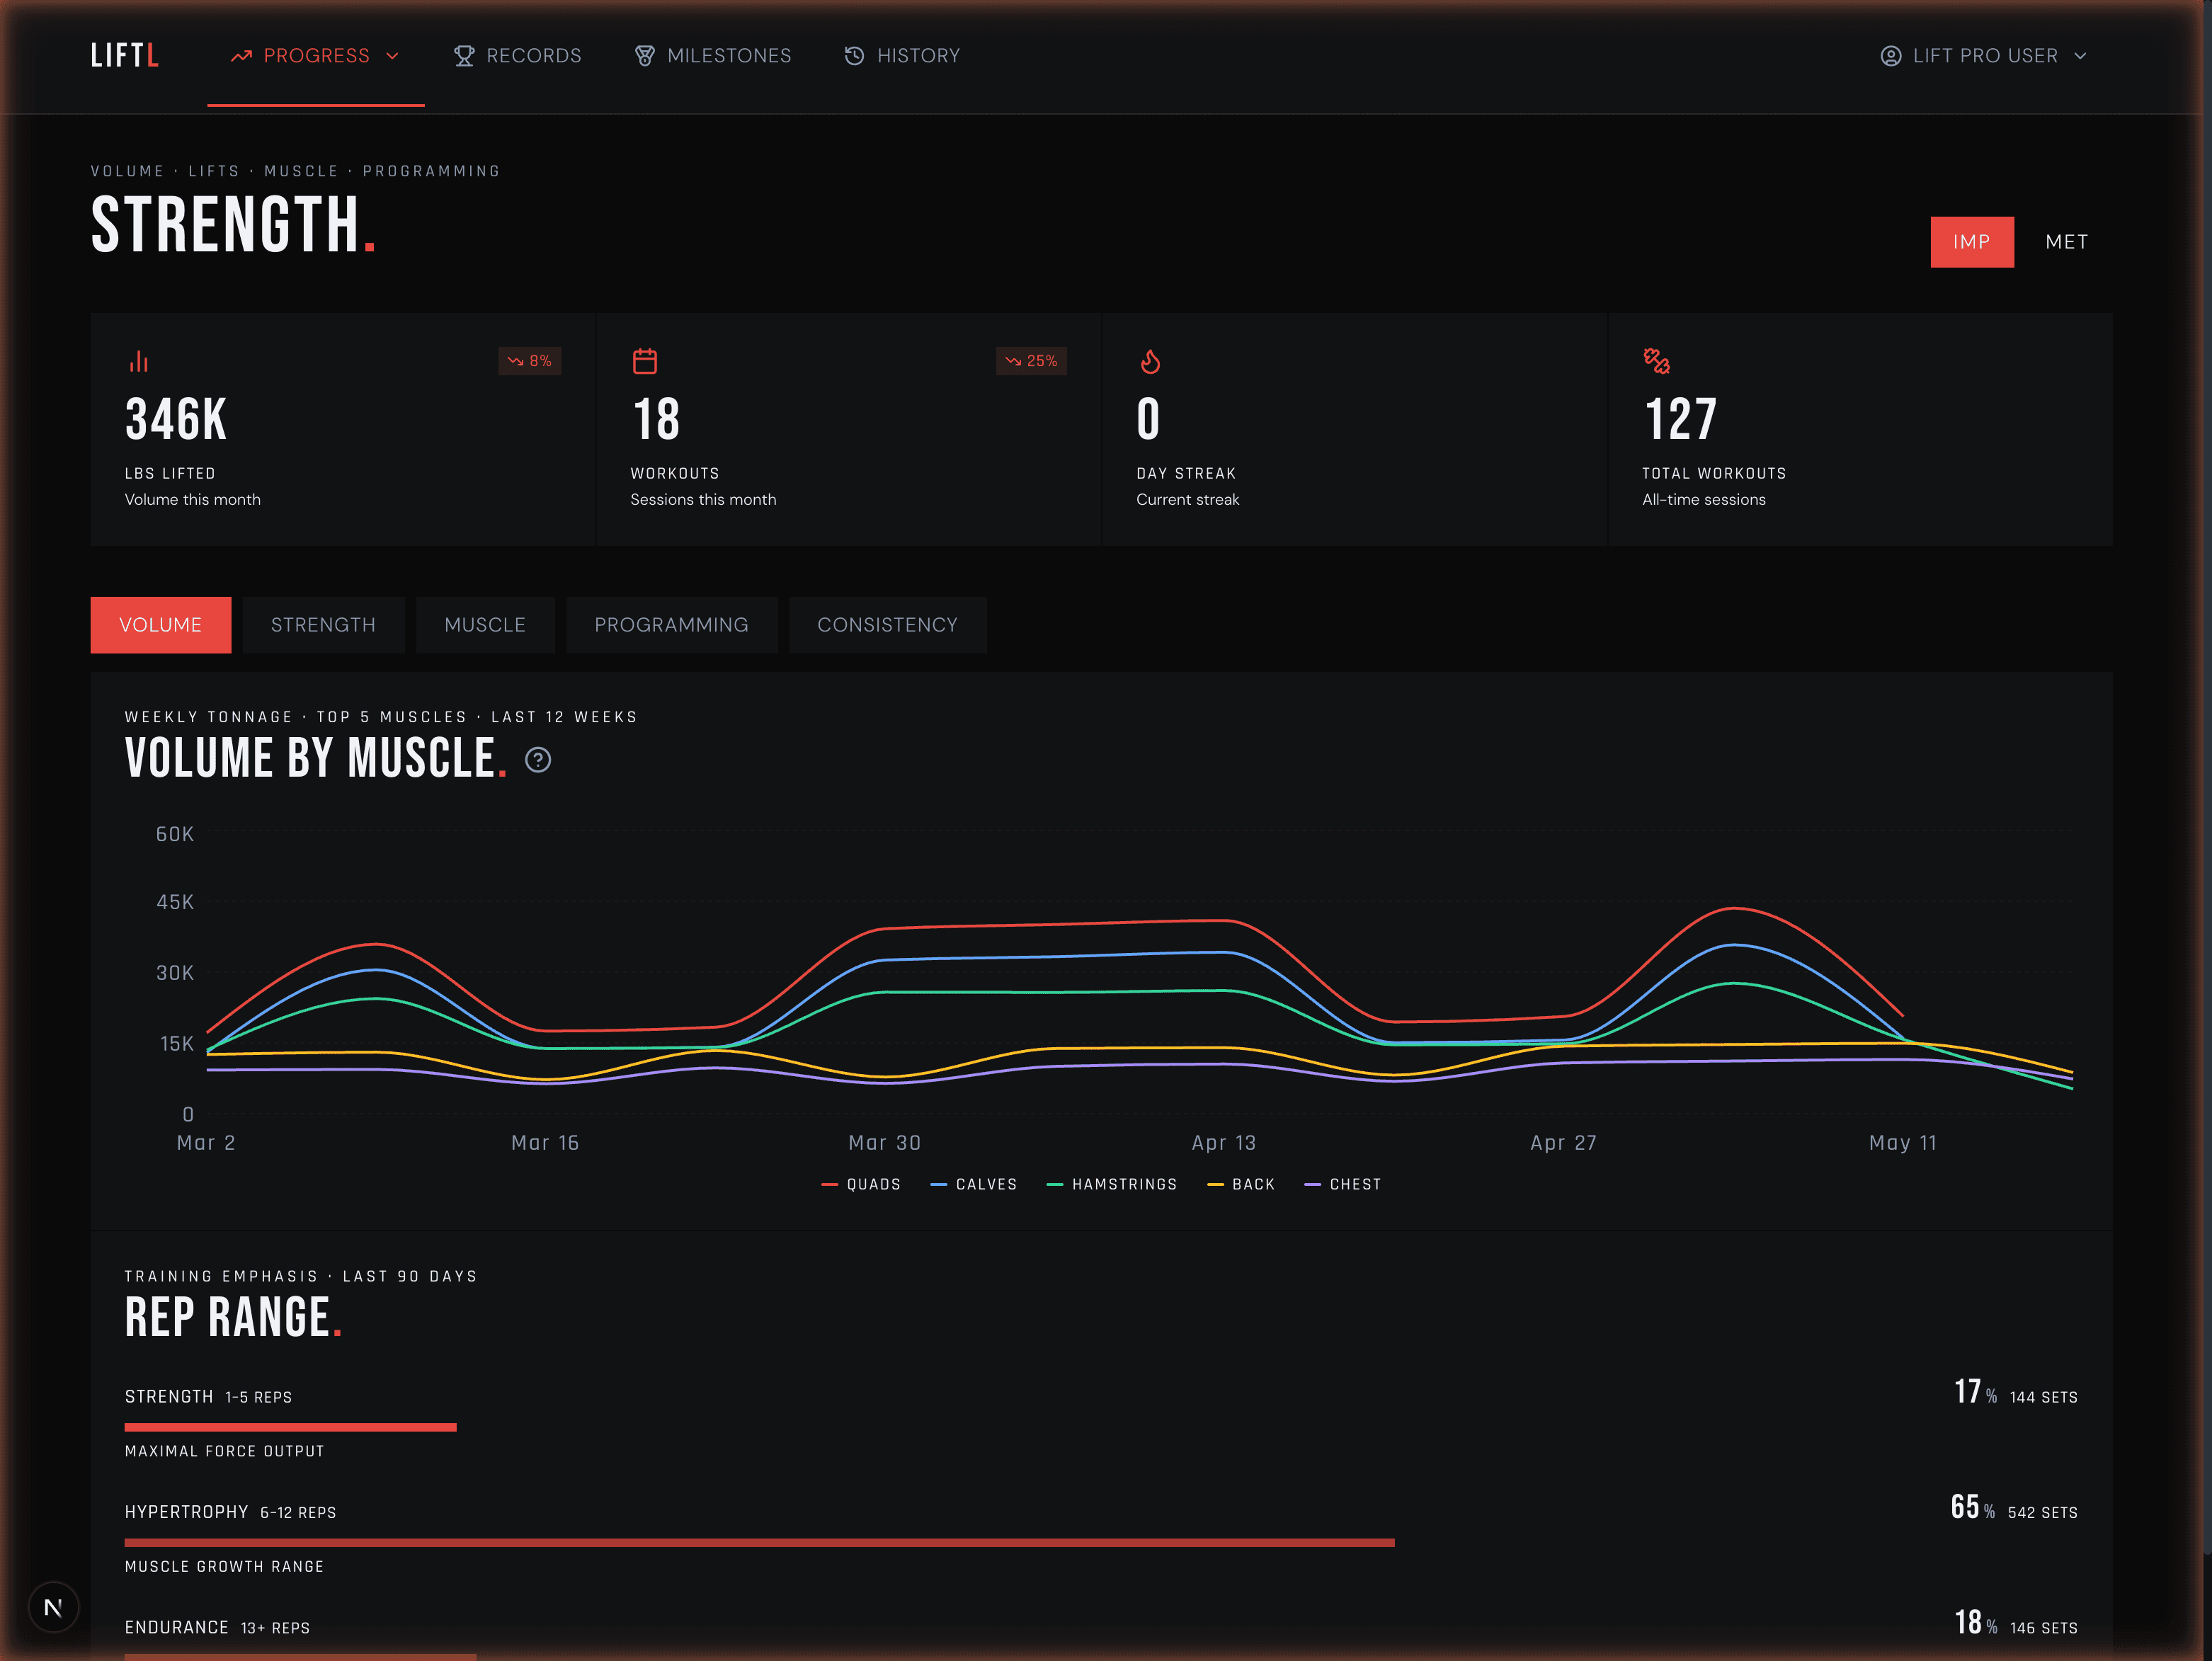
See weekly tonnage by muscle group, rep-range distribution, and where your training volume is concentrated.
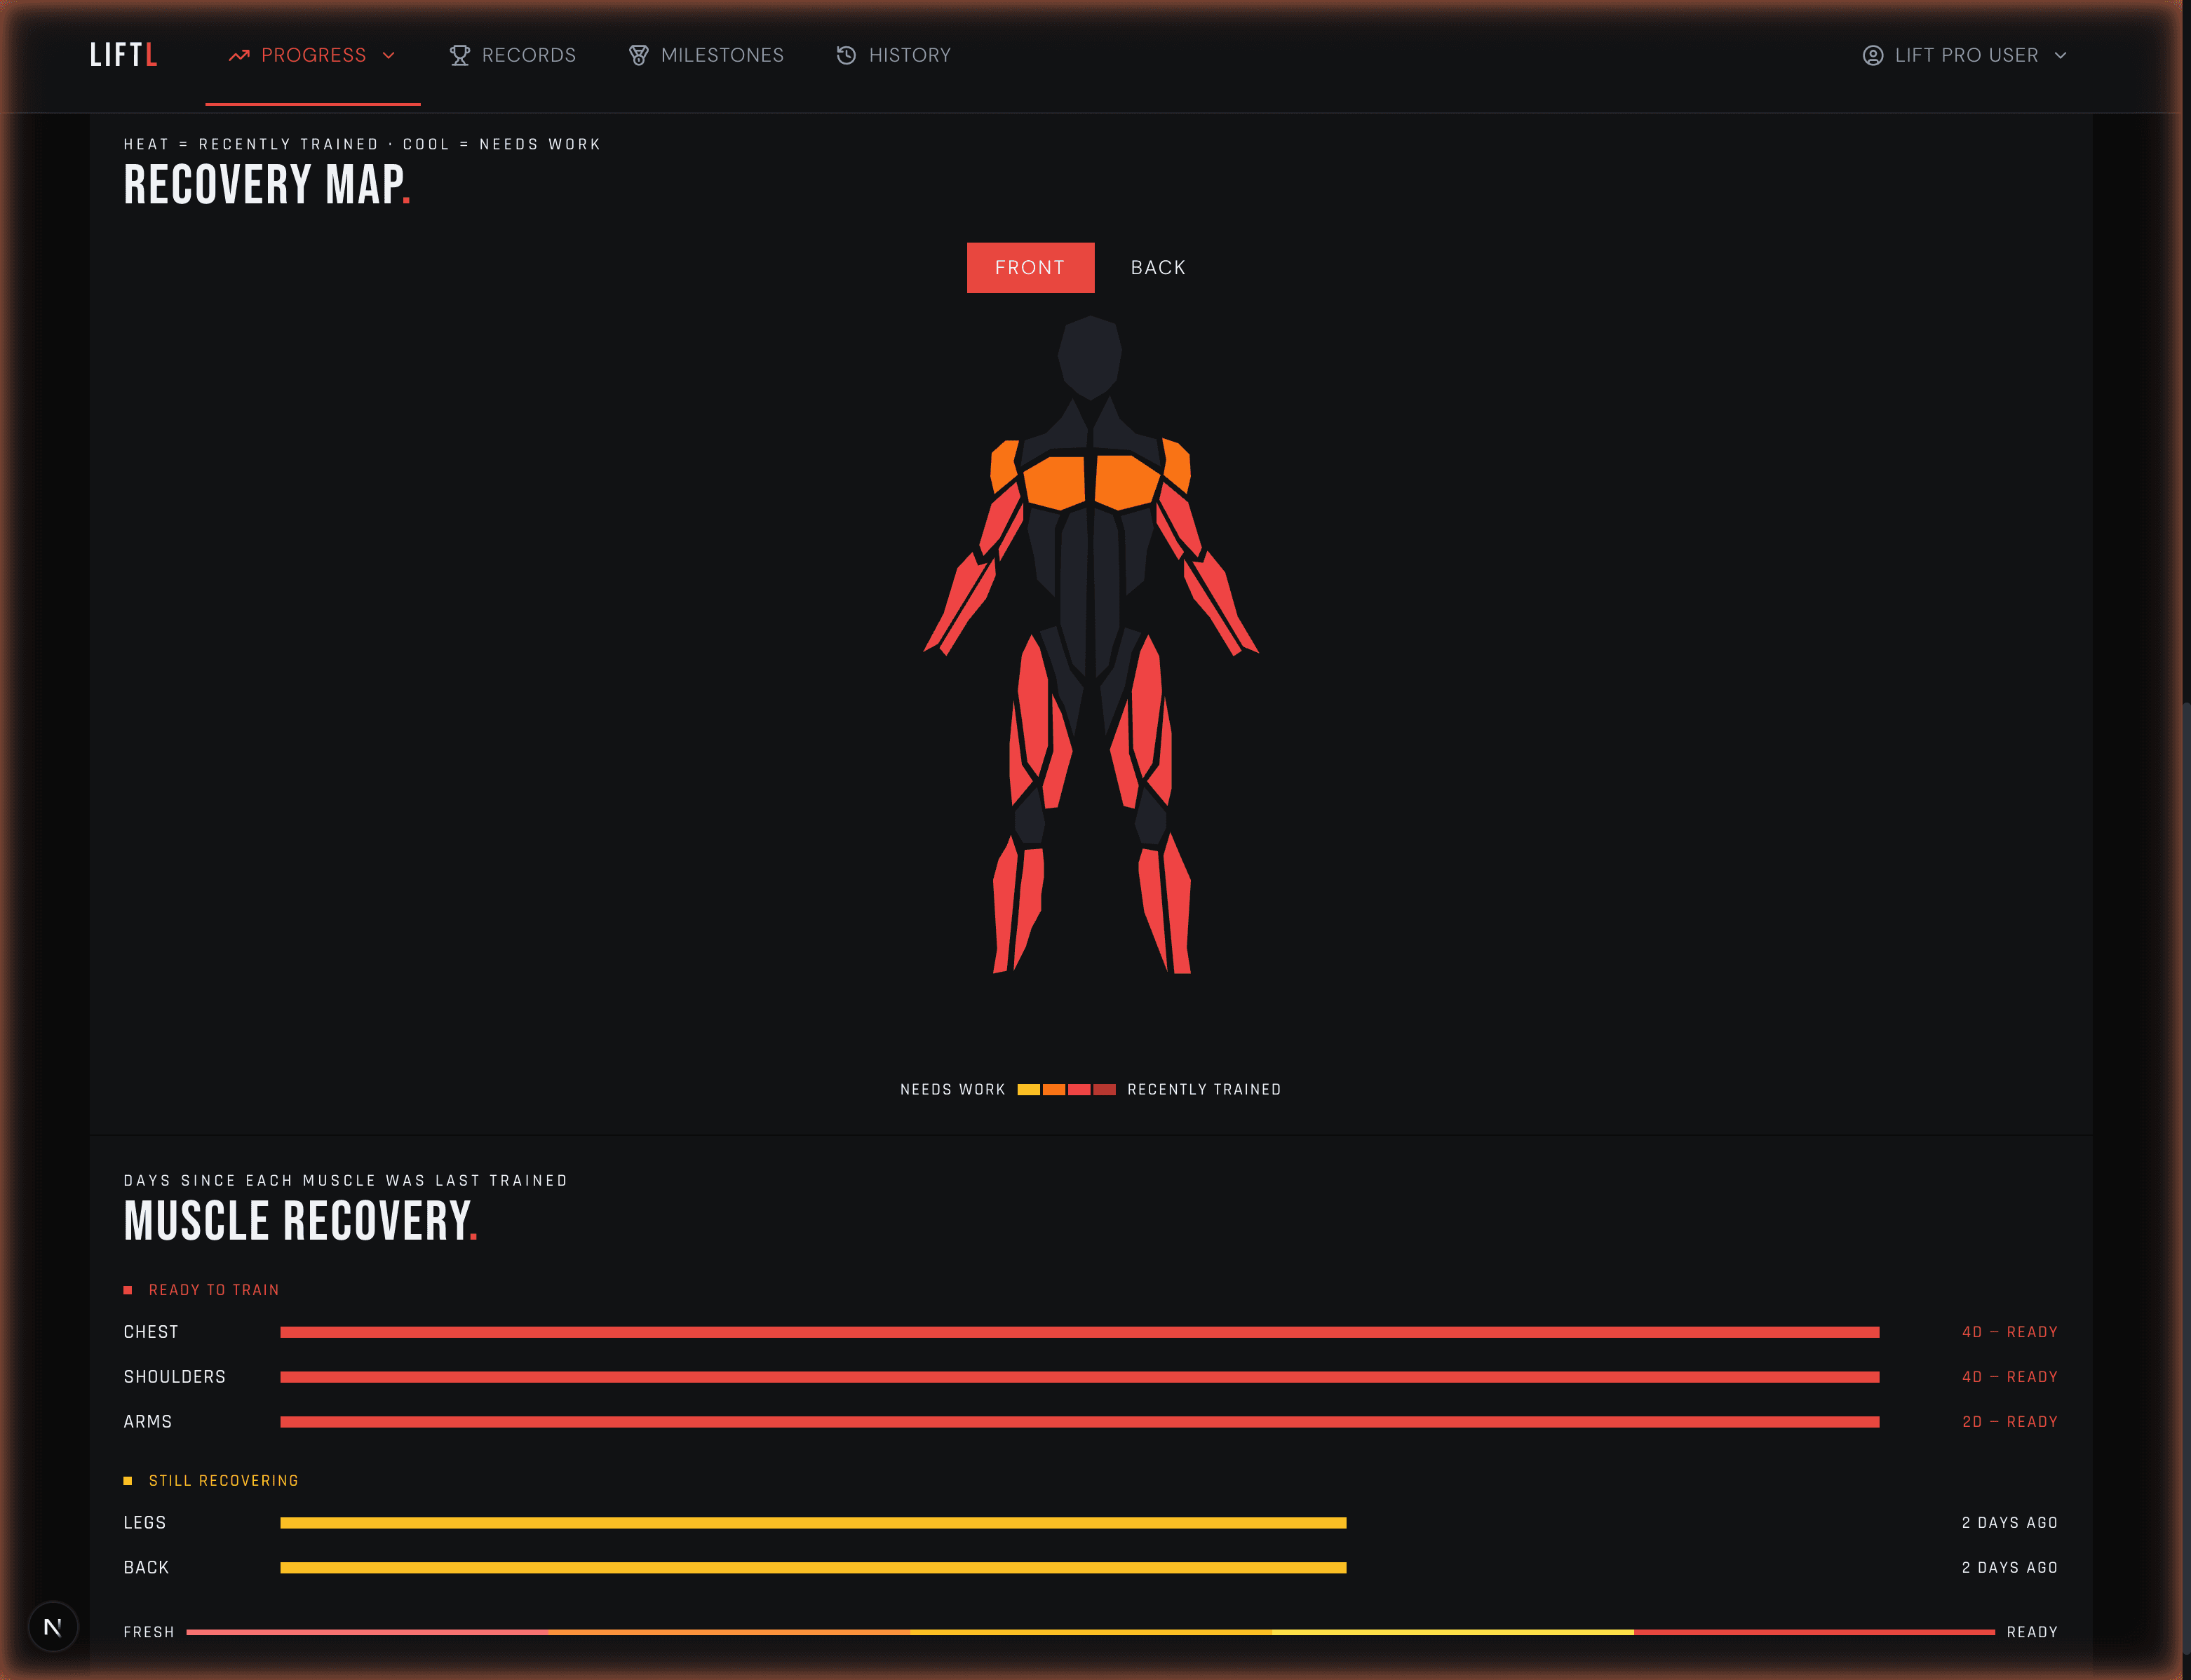
Compare recent workload with your rolling baseline and review how recently each muscle group was trained.
Personal-record history
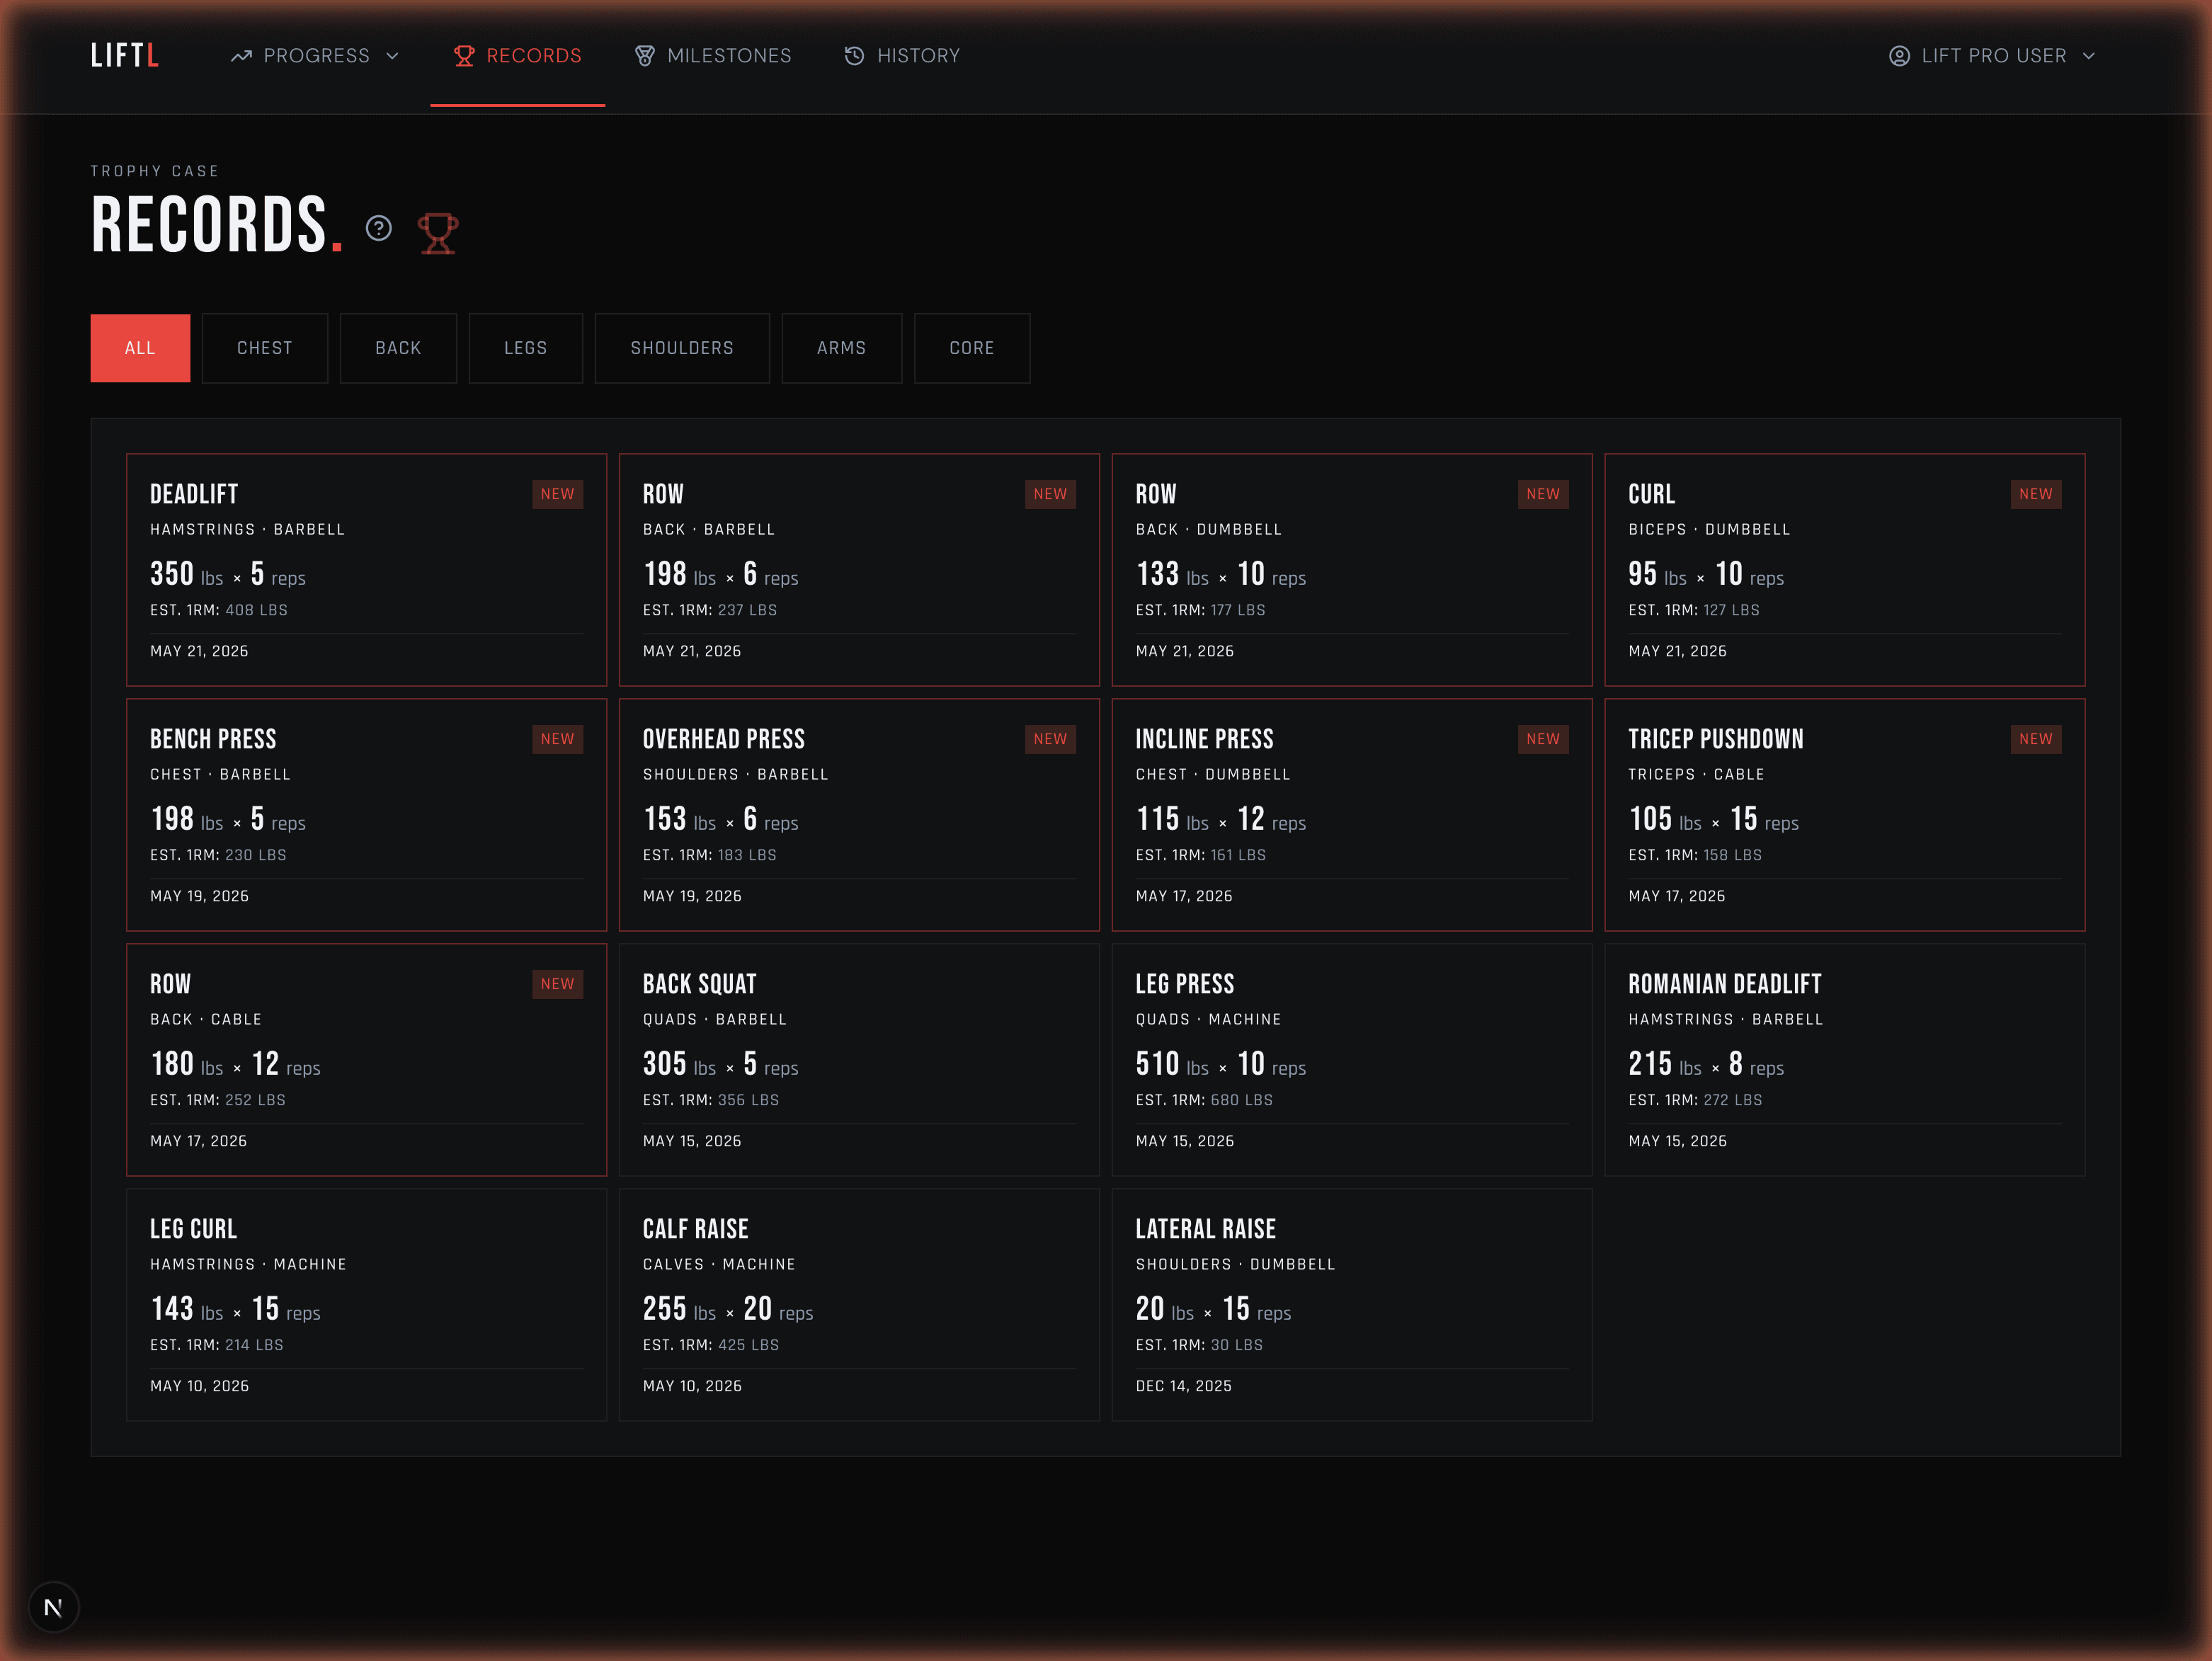
Review your best logged performance for each exercise in one place. Every record keeps the weight, reps, estimated 1RM, exercise variation, and date visible, with muscle-group filters when you want to narrow the list.
Volume with a destination
Weekly tonnage shows how training load changes over time. Muscle-group and rep-range views show whether that work is concentrated where you intended—or drifting somewhere else.
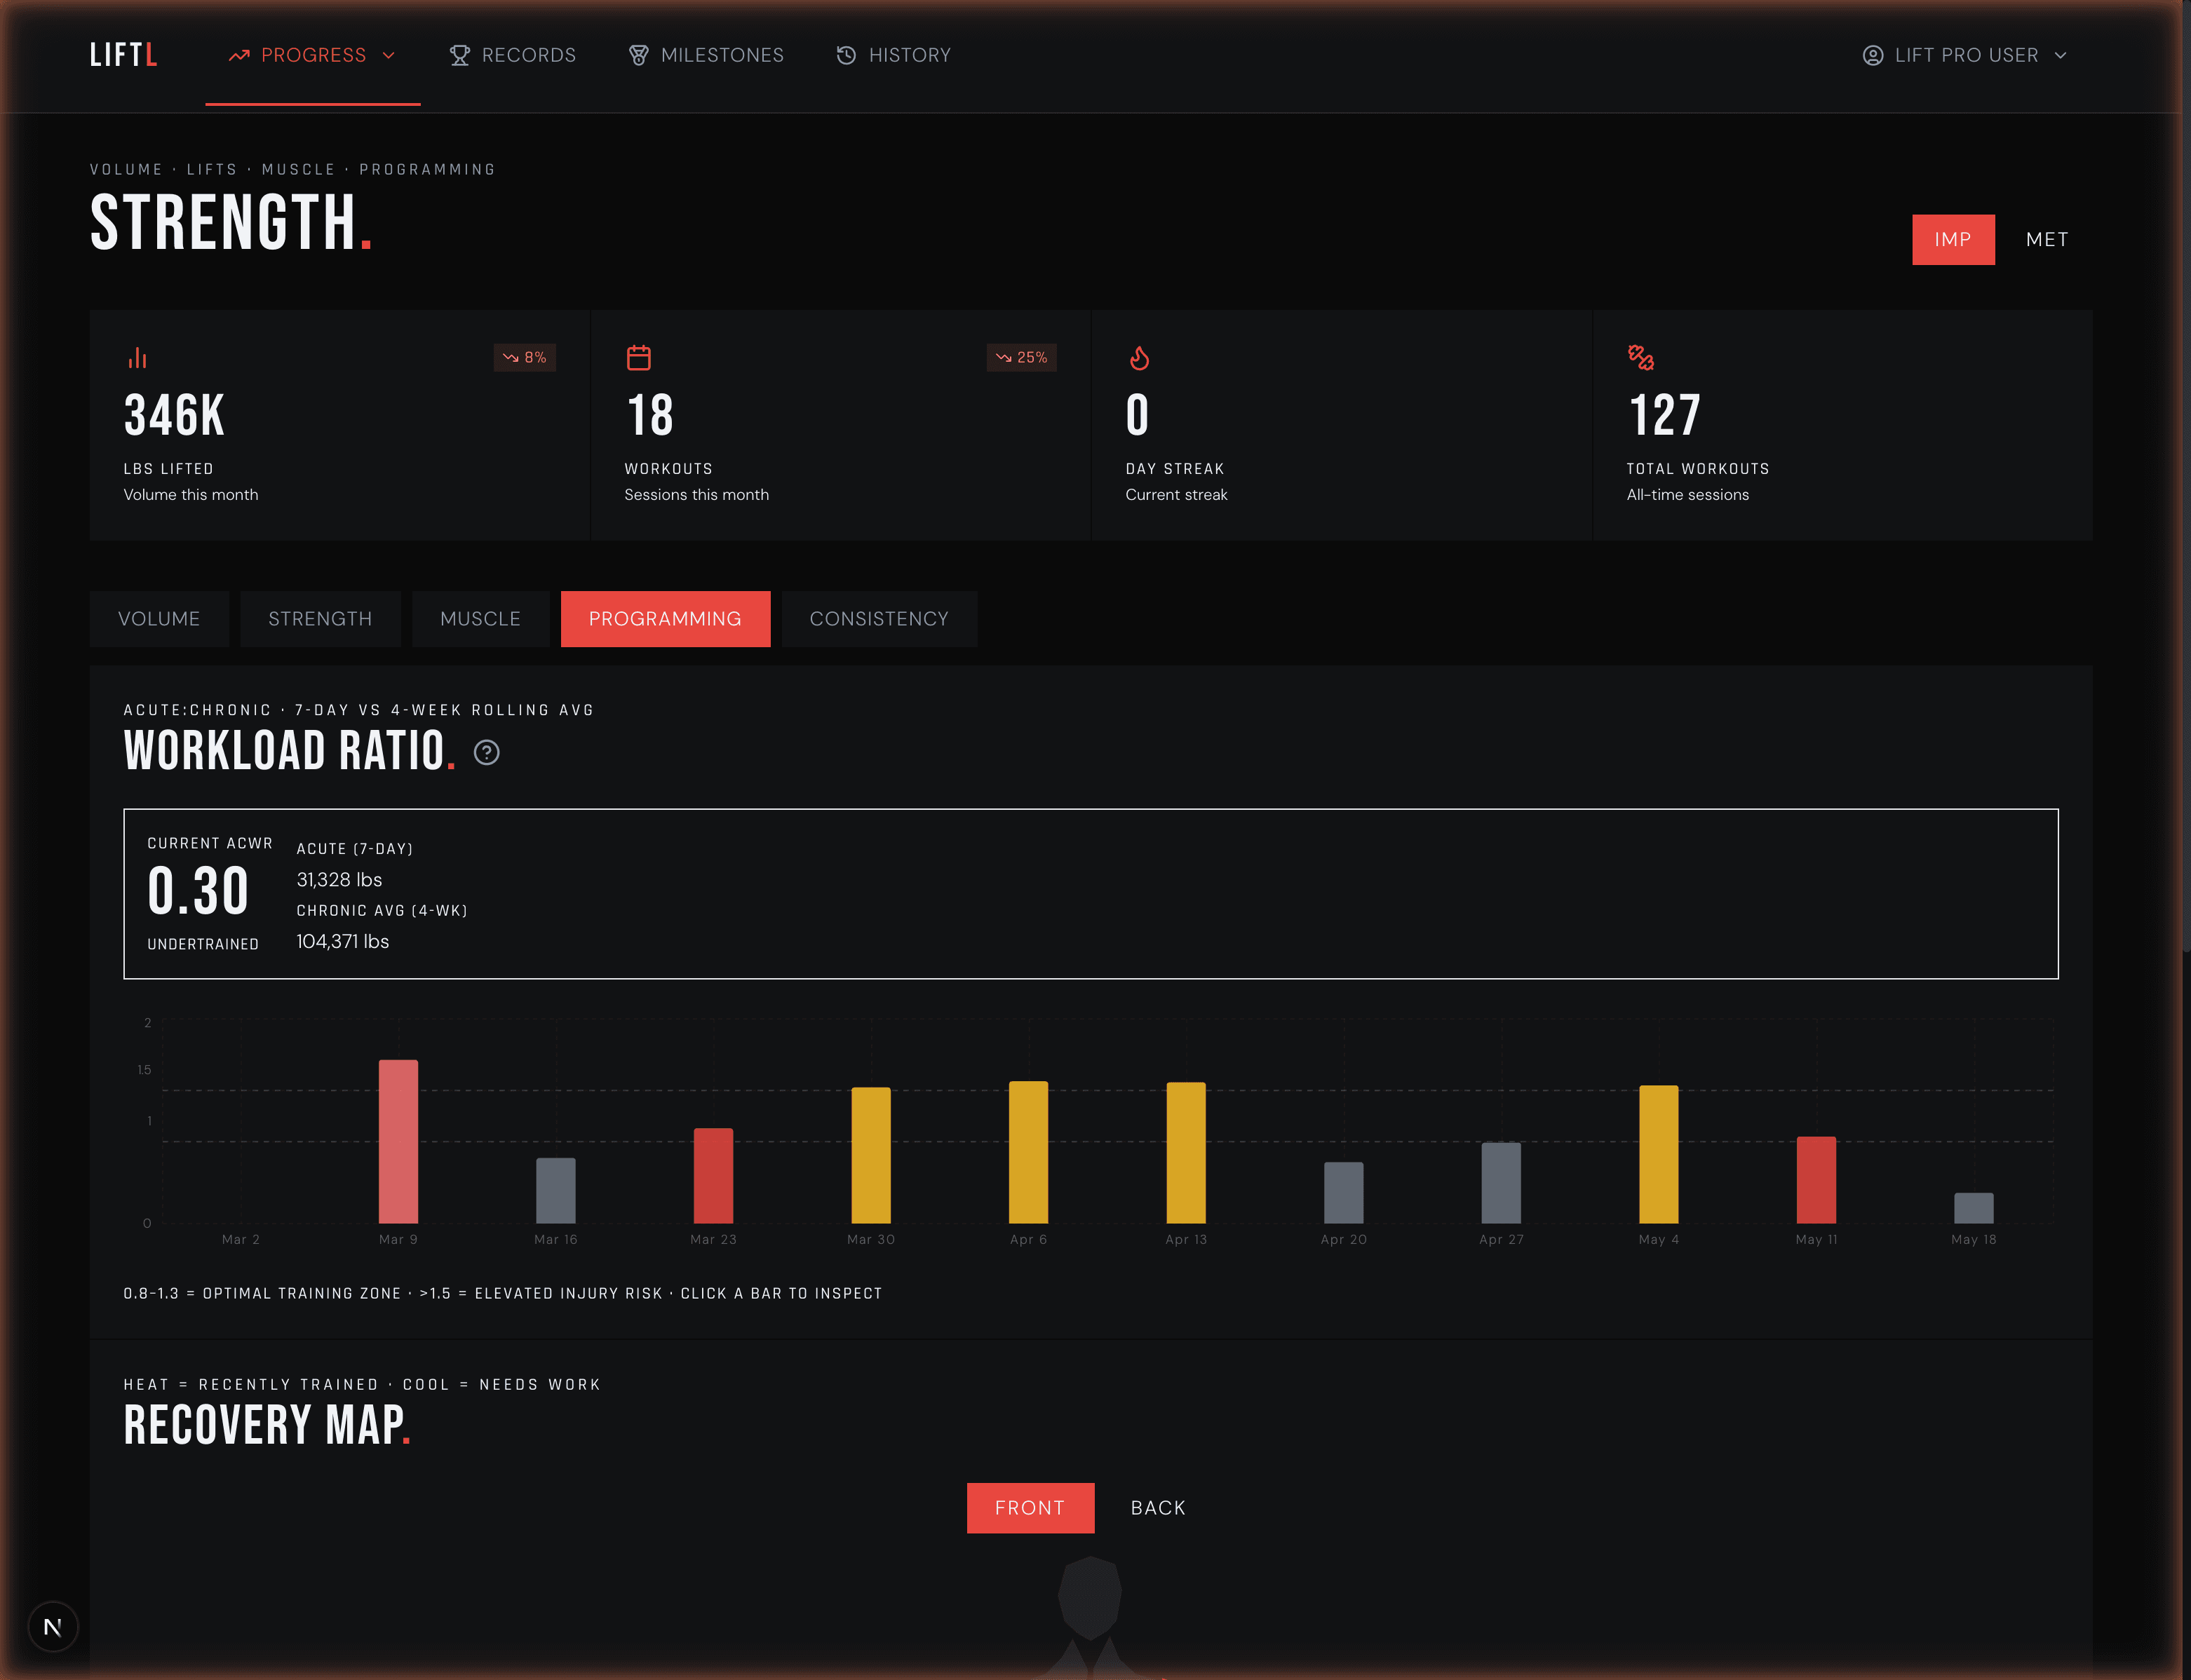
Programming context
The workload ratio compares this week's volume with the average from the prior four weeks. Select a week to inspect the sessions and exercises behind it instead of treating one number as the whole story.
The recovery view is deliberately simpler: it reports days since each muscle group was trained. It does not claim to measure tissue recovery, fatigue, or injury risk.
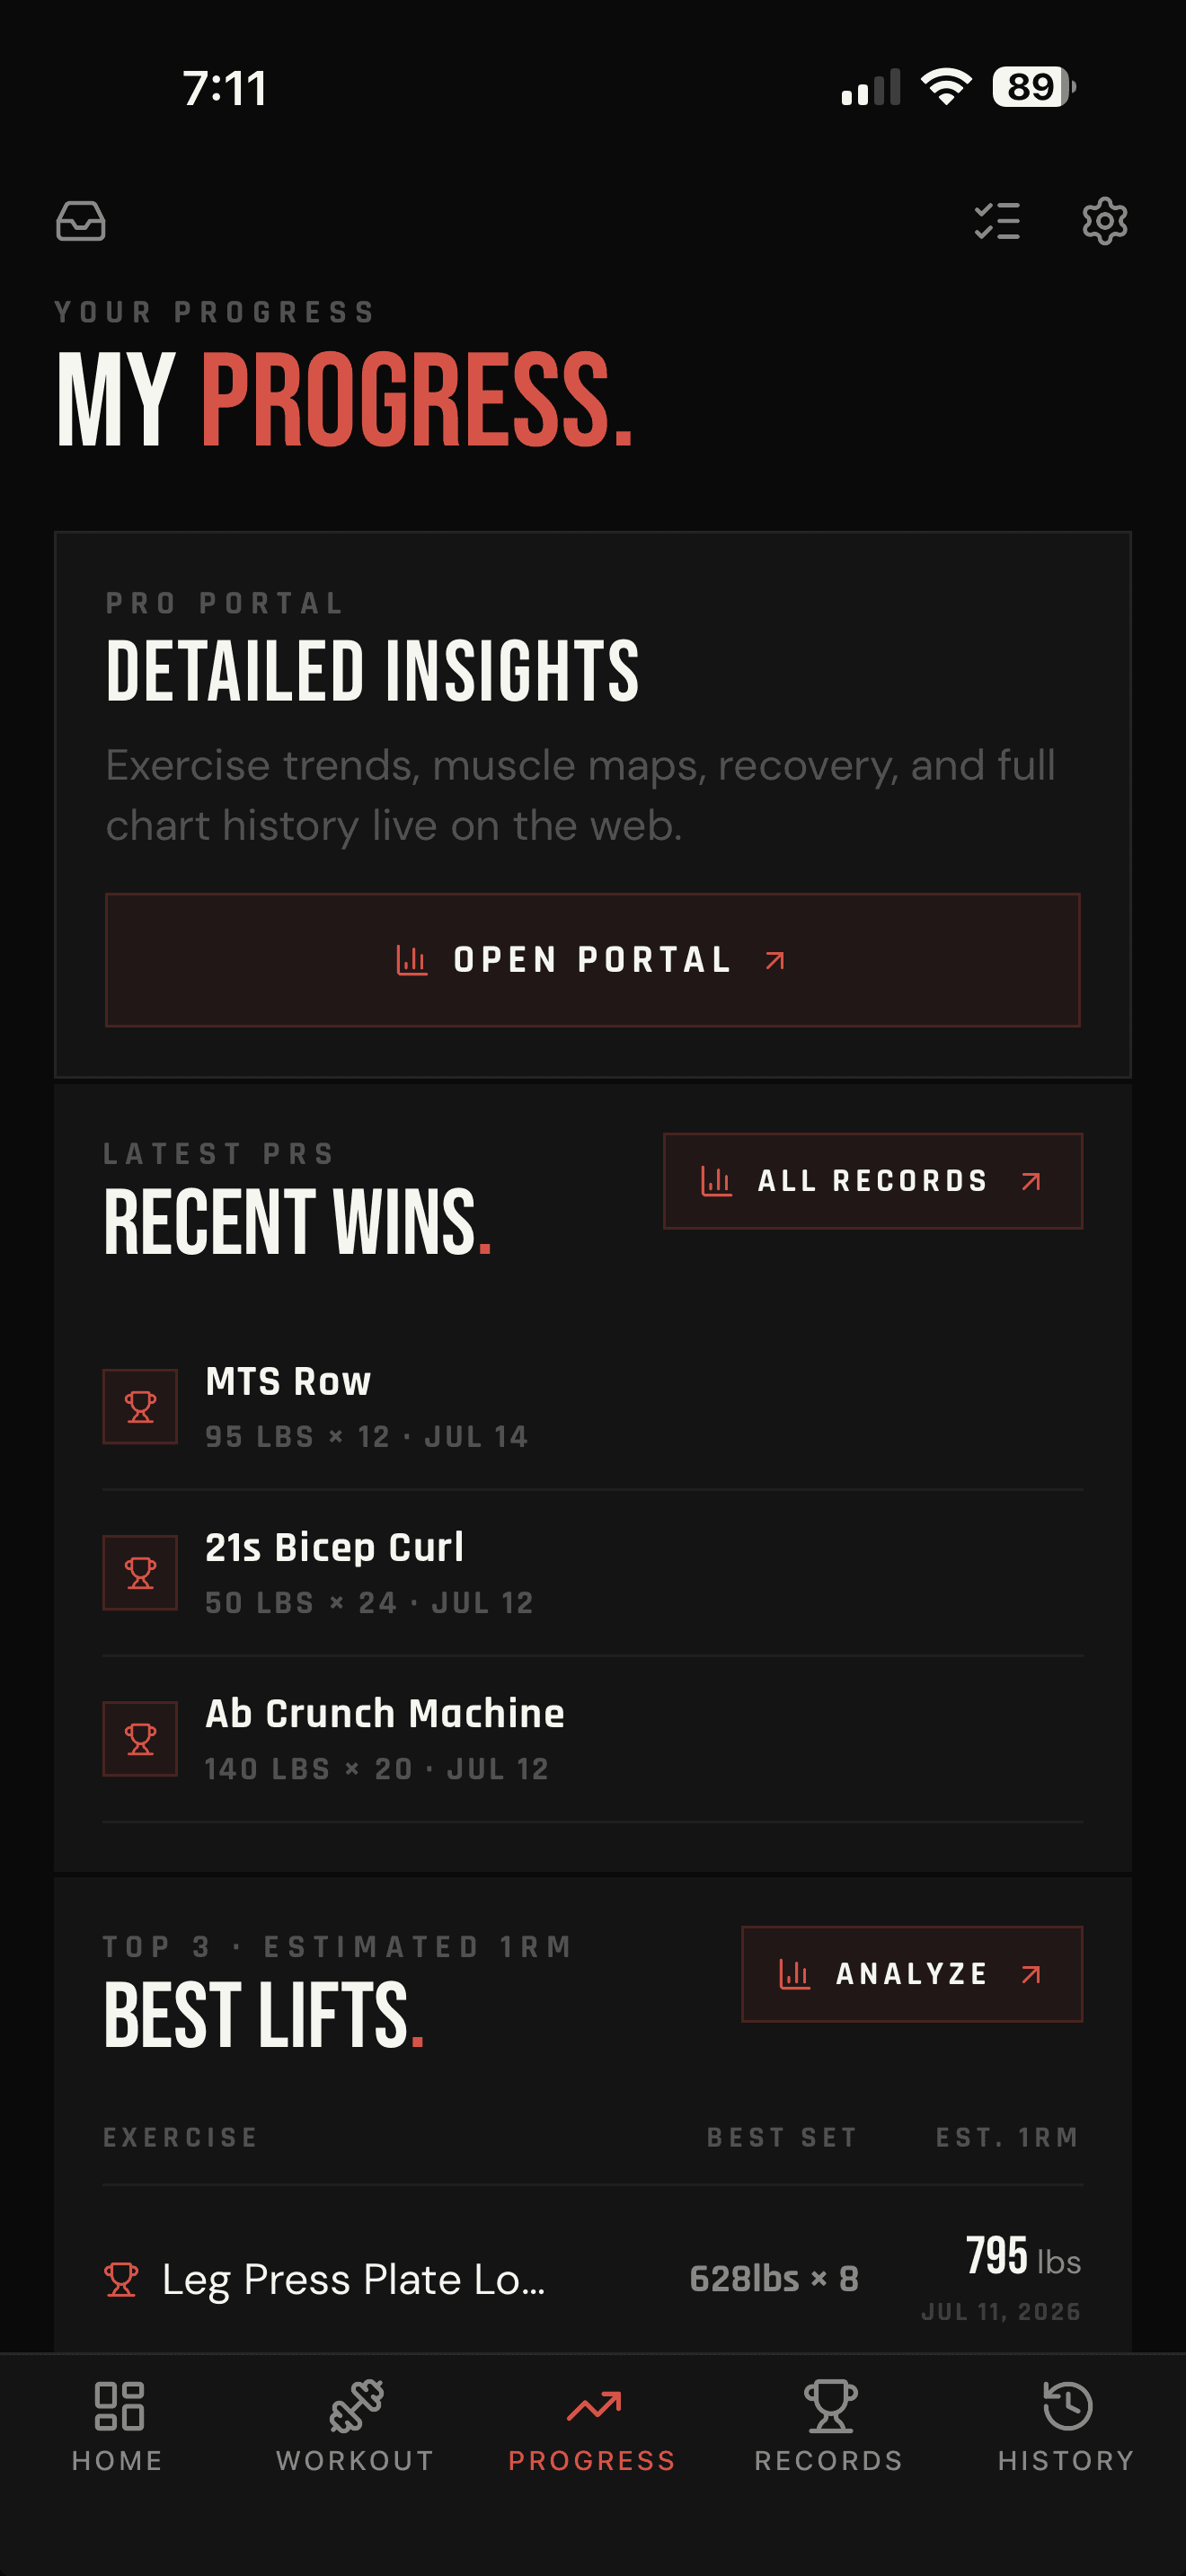
Phone for the summary. Web for the depth.
The mobile app keeps recent progress and records close to the workout. The companion Pro portal gives the complete charts enough room to compare exercises, muscle groups, training blocks, and long-term history.
This analysis begins with the same focused workout log used on the gym floor.
What the numbers mean
A consistent way to compare logged sets across rep ranges—not a tested maximum.
Days since a muscle group was trained—not a biological recovery score.
Recent volume compared with your rolling baseline—not medical or injury advice.
Frequently asked questions
LIFTL includes estimated 1RM trends, progressive-overload comparisons, weekly volume by muscle group, rep-range distribution, push, pull, legs, and core training balance, consistency, workload ratio, muscle-training recency, and personal-record history.
LIFTL uses the Epley formula: weight multiplied by one plus reps divided by 30. A single-rep set uses the logged weight itself. Estimated 1RM is for comparing sets and tracking trends; it is not a tested one-rep max.
LIFTL compares the best estimated 1RM for each exercise over the latest four weeks with the previous four weeks. Changes of at least two percent are shown as rising or falling, and smaller changes are shown as flat.
The recovery map shows how many days have passed since each muscle group was trained. It is a training-recency view, not a physiological measurement of whether a muscle is fully recovered.
The acute-to-chronic workload ratio compares the current week’s volume with the average weekly volume from the prior four weeks. Its zones are general training-load guidance, not medical advice.
Workout logging is free. The complete analytics suite and companion web portal require LIFTL Pro. Your device’s store shows the current price before purchase.
Yes. The mobile app surfaces progress and recent records, while the Pro web portal provides more space for the complete charts and historical analysis.
Need calculation details? Browse the LIFTL progress and metrics FAQ.
Build the history first
Install LIFTL free and start building the workout history behind every chart.
Get LIFTL